Harmanpreet Kaur
Web and Mobile Application Development, Langara College
Overview
What is React?
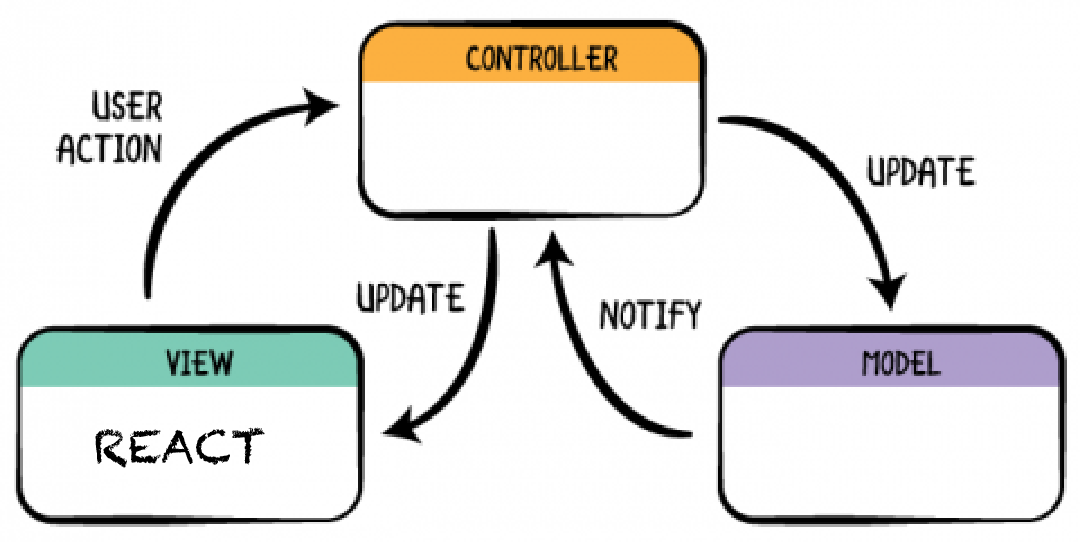
React is a JavaScript library for building User Interfaces. It was created by Facebook developers in 2013. It is used with JSX (an extension to Javascript), which basically allows you combine HTML and JavaScript. It is the View part in MVC model as it is used to create individual UI Components which can be combined to create a complete interface.
Why React is Awesome?
- Reusable Components: React allows you to create encapsulated UI elements in the form of Components which can be reused in future projects. This adds another dimension to web development where we can create reusable UI elements.
- Unidirectional Data Flow: React has a unidirectional data flow which is implemented using the parent child architecture. This makes it easy to track the source and the destination of the data which is an advantage over other libraries like Angular which incorporates two-way data binding.
- JSX (HTML + JavaScript): JSX is a JavaScript extension that allows you to combine HTML and Javascript. We can use JSX to write simple HTML inside our JavaScript documents, which makes React code easy to develop and understand.
- Mobile Apps/ VR : React is not just limited to web applications. You can use it to create mobile applications using React Native and for Virtual Reality projects using React VR.
How React works?
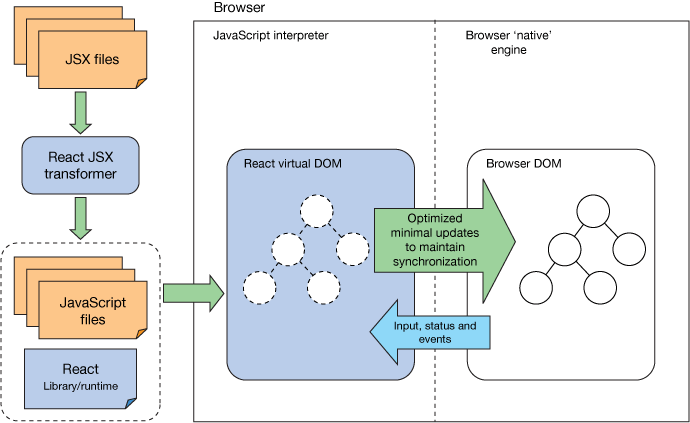
React helps implementing browser independent DOM systems to enhance cross platform compatibility. It uses the concept of a Virtual DOM. User changes are reflected upon the Virtual DOM. React keeps a track of the browser's actual DOM and the virtual DOM and syncronizes them at the right time. This is done to optimize minimal updates to the browser's actual DOM.
Hello World
See the Pen WgWemO by Harman Parihar (@harmanparihar) on CodePen.
Conclusion
React is a trending technology which has a small learning curve for someone who is familiar with JavaScript. It has a huge support community, consisting of approximately 70,000 question over stack overflow. There has been an incredible growth in the number of websites that use React all over the world and this figure is predicted to increase over coming years. Some of the major companies that use React include Facebook, Instagram, Netflix and many more.
Prototype
Idea
The goal is to achieve creating User Interfaces containing dynamic data visualization components using React for my team's project.
User Stories
User
As a user, I want data presented in pictorial form, so that I can avoid going through hundreds of records in the database to find trends or make conclusions regarding dataset.

Student
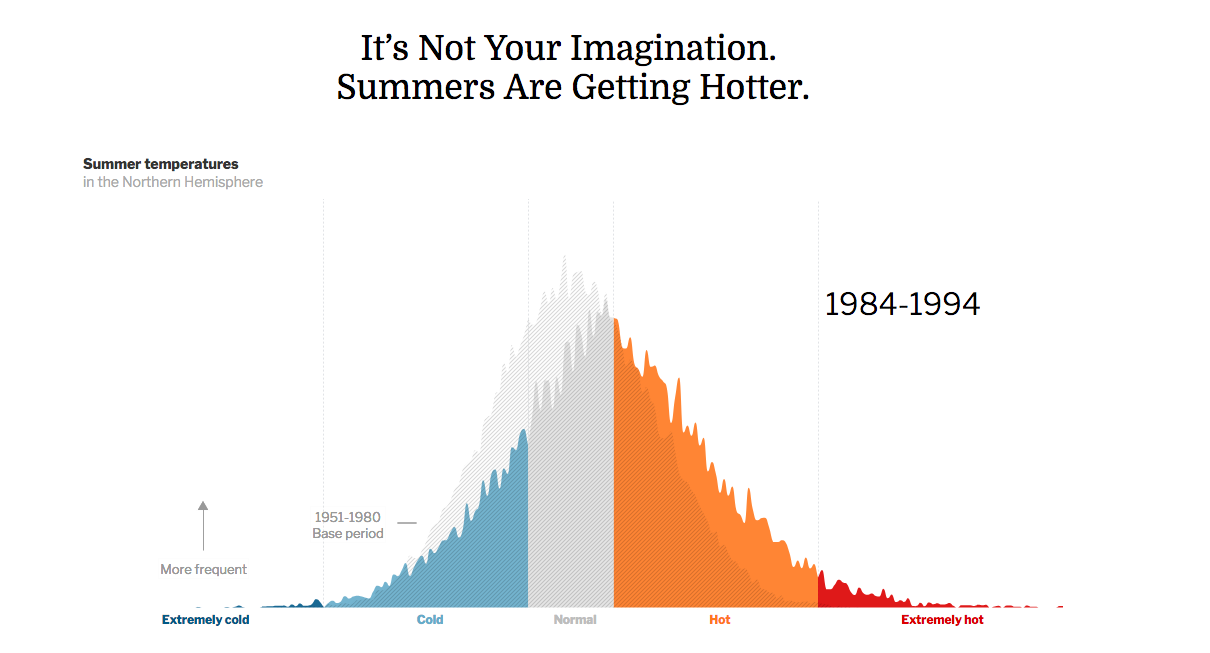
As a student, I want interactive visualizations of global climatic change statistics, so that I can manipulate the data being represented according to my needs.

Instructor
As a Geography instructor, I want an interactive dashboard on my personal blog displaying global climate change statistics, so that I can share the current trends, causes and effects with my students.
Prototype Progress Report
Retrospective of Last Week
- Work Environment Setup for React Projects
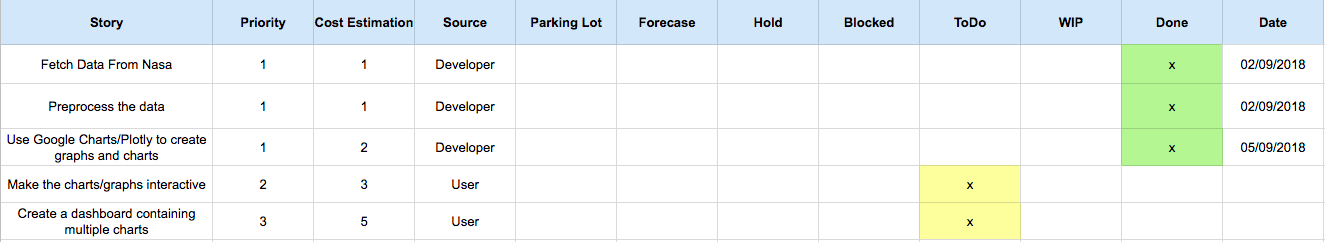
- Created a React Calculator App to understand the interaction between properties and states. (GitHub Link)
- Deployed React Calculator App on Heroku.
- Started creating graphs and charts using Google Charts and PlotlyJS.
- Velocity : 7
Excel Backlog
Plan for Next Week
- Create multiple Charts and interactive graphs.
- Use React to create a dashboard using the above visualizations.
- Prepare for the Prototype Demo Presentation.
Prototype Demo
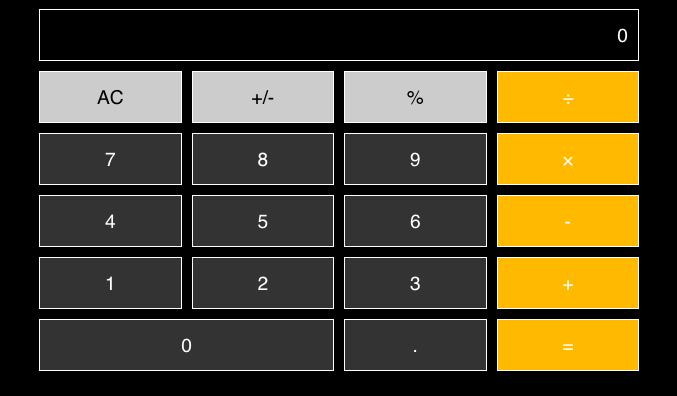
React Calculator
A simple react application that performs arithematic calculations.
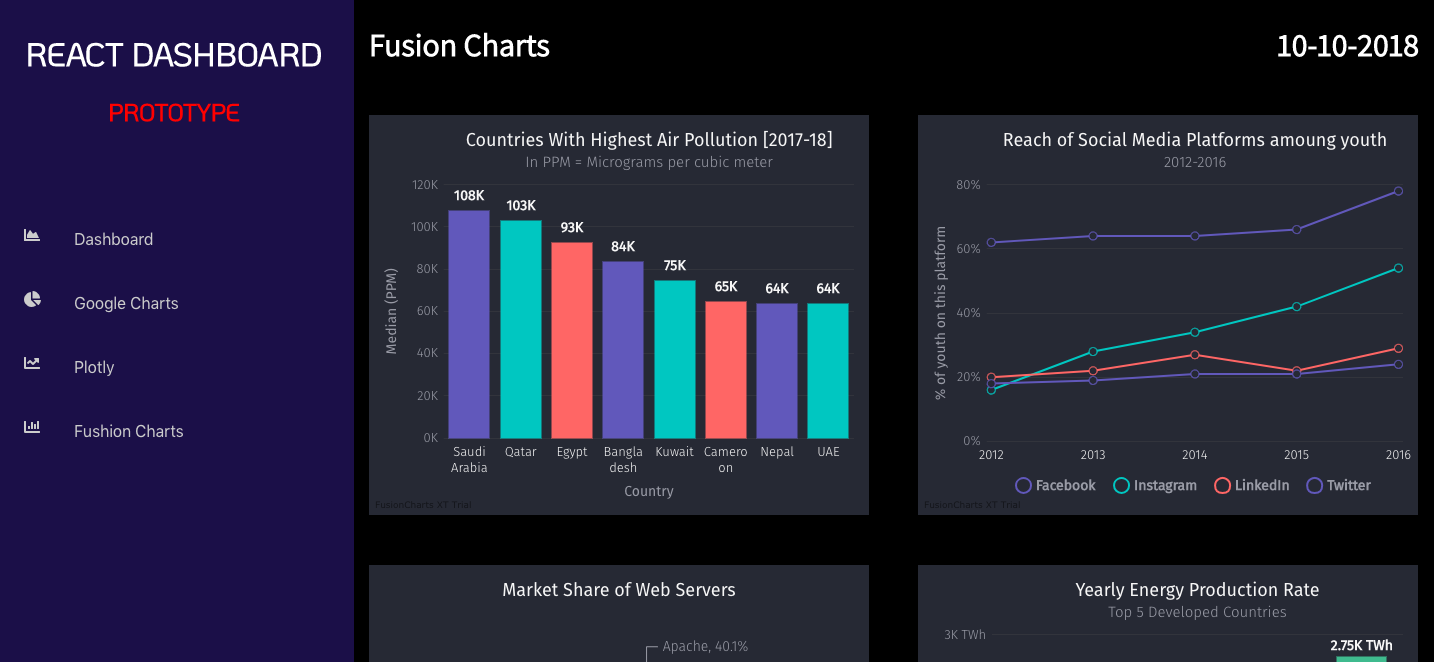
React Dashboard
A react application that uses Google Charts and Fushion Charts JavaScript libraries to create a dashboard.
Retrospectives
Executive Summary
React Calculator
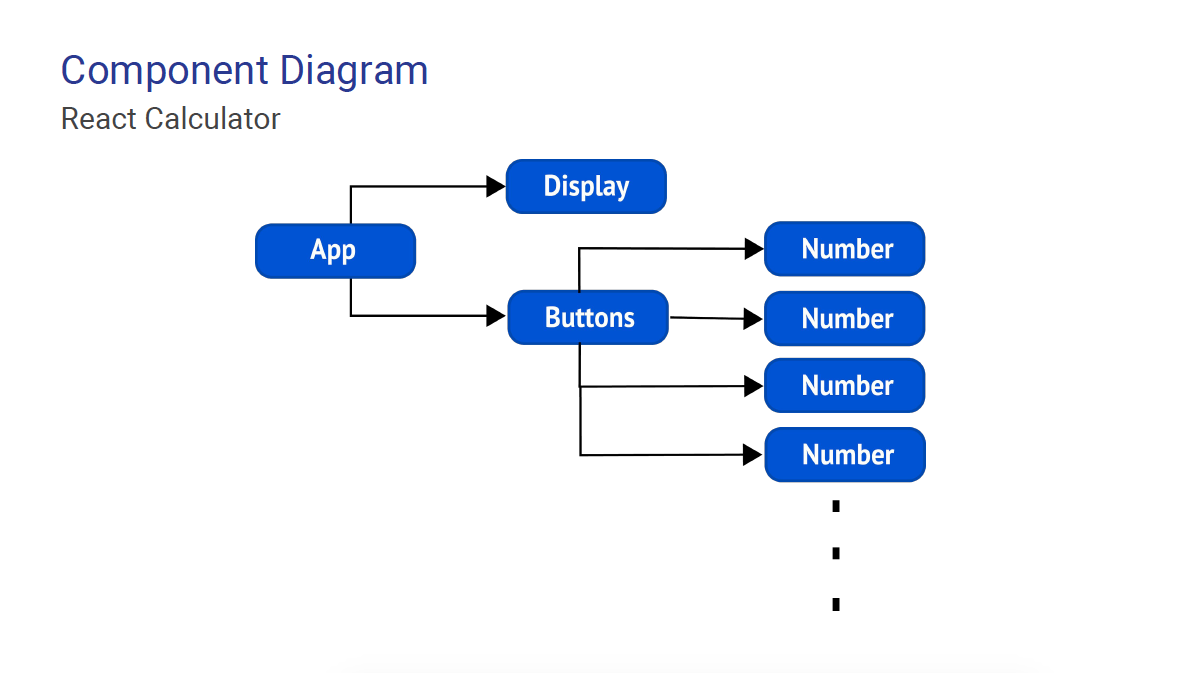
I built this prototype while learning how states, properties and events interact with each other in React. It basically contains simple react components like Display, Buttons and Numbers that interact with each other to capture onClick event to modify the number being displayed and the final result for the arithematic expression.
React Dashboard
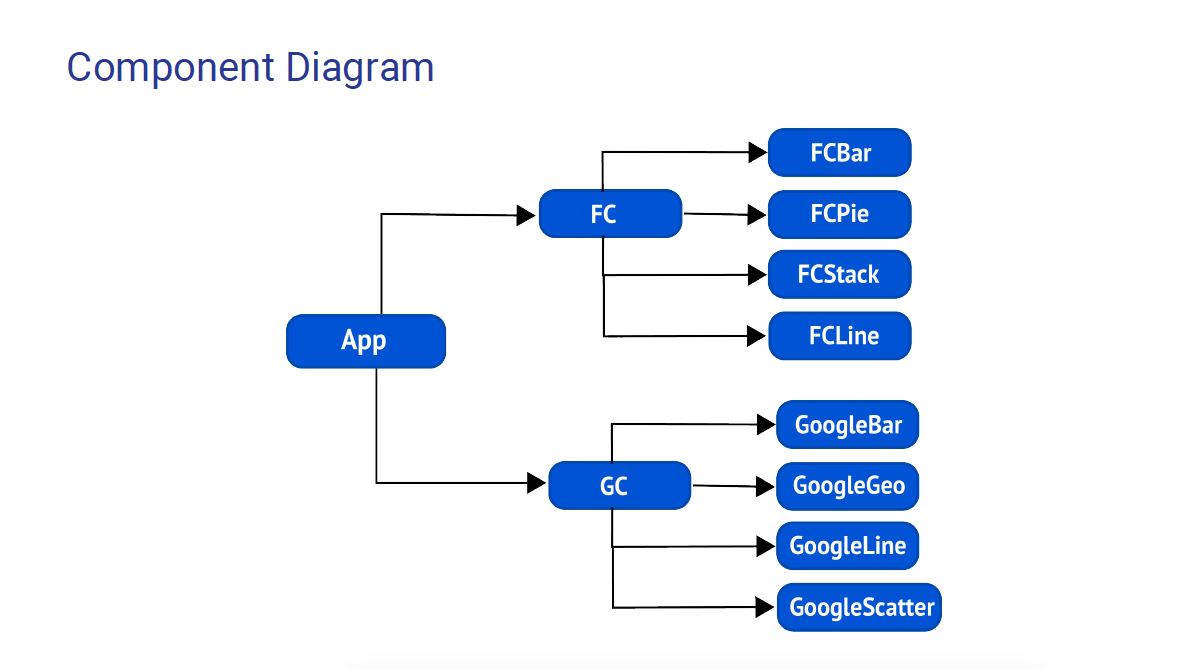
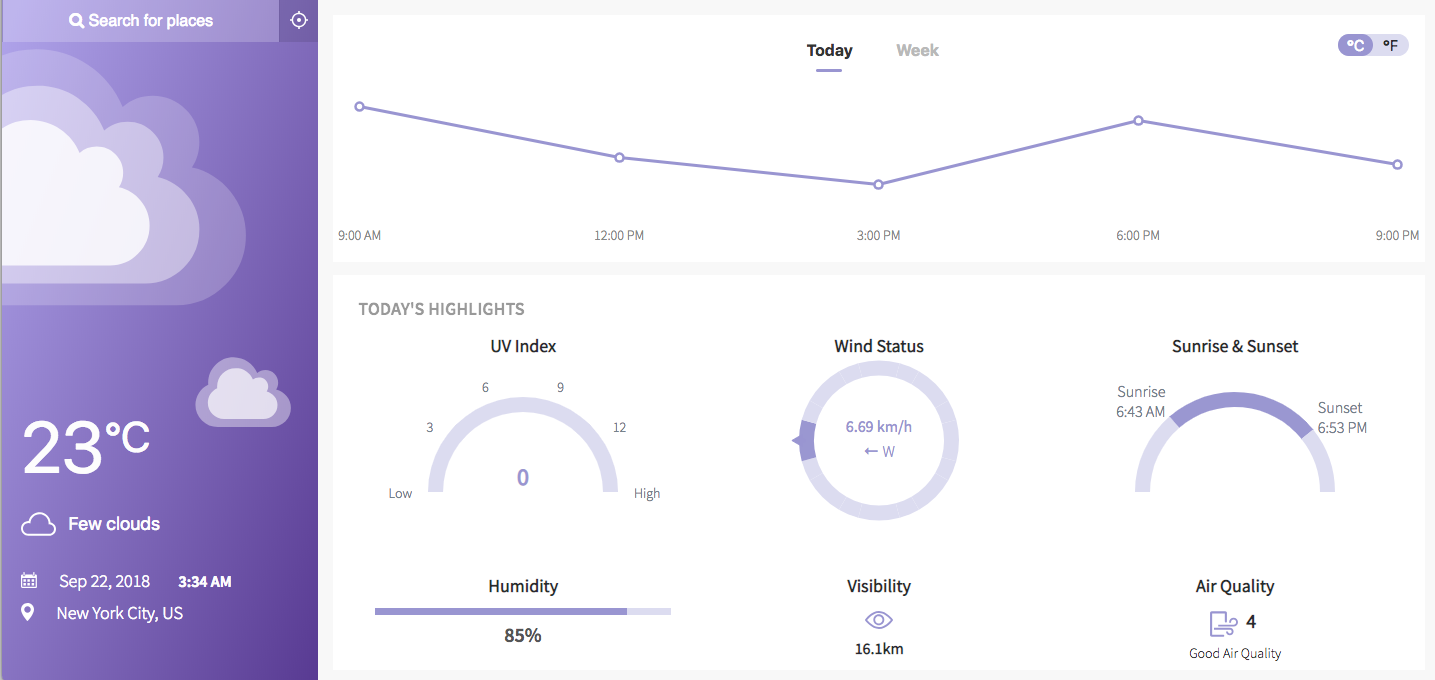
The react dashboard that I created combines data visualization libraries like Google Charts and Fusion Chart together to create components of individual visualization being displayed on the dashboard. The app renders only that particular graph that the user is interacting with using the abilities of react, optimizing the rendering process.
What Went Well
create-react-app :
Helps to create bootstrap react applicationsComponents, States & Events :
Understood how React works behind the scenesHeroku :
Deployed applications on Heroku successfullyCommunity :
Had help whenever I got stuck
What Did Not Go Well
Error R14 (Memory quota exceeded) :
Dashboard app was hugeHeroku Deployment using Webpack :
Had to switch to create-react-appPersonalized Interactive Charts :
Limited control availableTime Management :
Some of the issues were time consuming
What was interesting
- Working with react
- Heroku Deployment
What would be done differently
- Will try to use code sampling for reducing the app size
Project Plan
I am planning to use react for my Project Global-Stats to create following sections of the web app :Data Visualizations :
Displays charts and graphs to visualize dataBlog :
Users can post, update and comment on our blogBasic UI Components :
Header, Footer, Sidebars, Navigation Bars, Search Bar etc.